Decoding the Contradiction
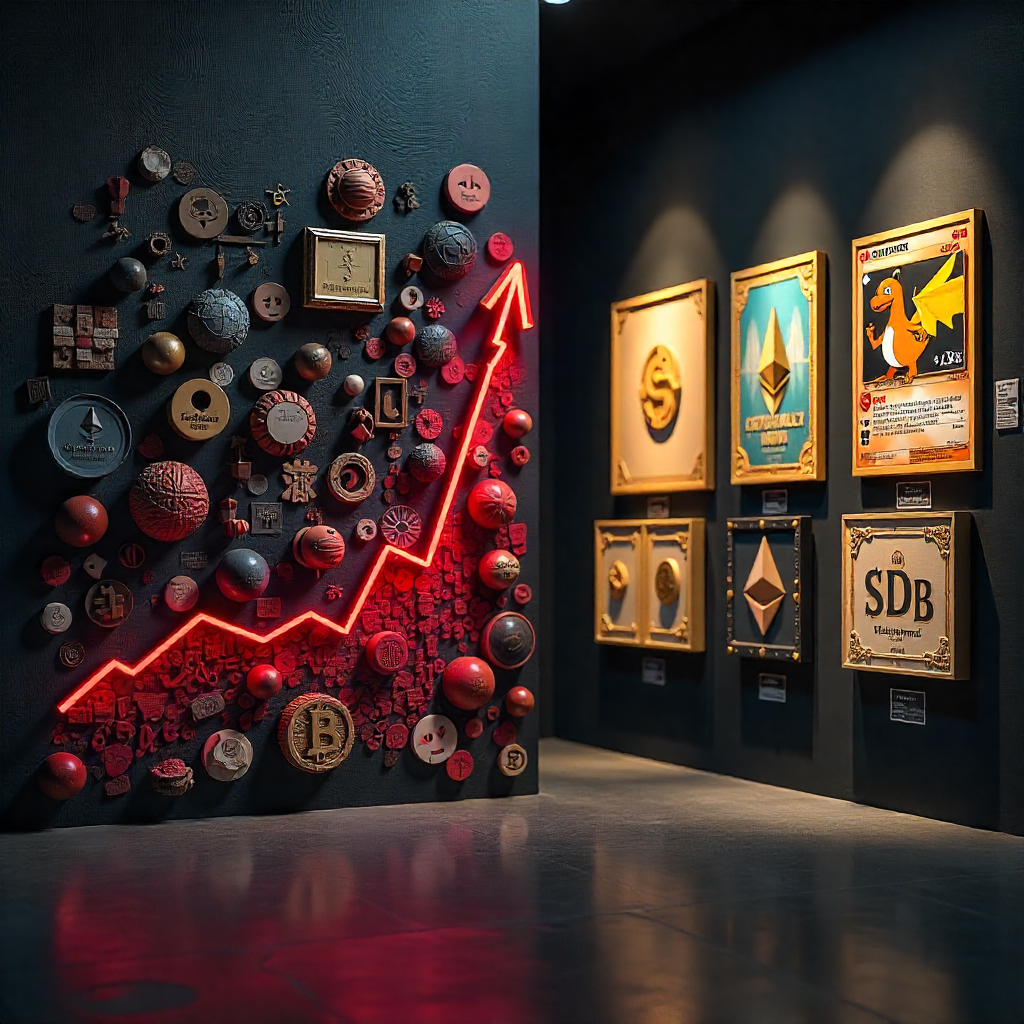
The NFT market just delivered a head-scratcher: $2.83 billion in H1 2025 sales—despite a 4.6% drop in trading volume. This paradox signals a seismic shift. Value isn’t vanishing; it’s concentrating. While transaction counts surged 78% in Q2 alone, average prices held steady at $80-$100. The frenzy for cheap speculative assets? Gone.
Instead, collectors are pivoting to utility-driven niches: Gaming NFTs now dominate 38% of sales, Real-world asset (RWA) tokenization surged 32% YoY, and Blue-chip art like CryptoPunks anchors portfolios amid volatility.
This isn’t stagnation—it’s maturation. For savvy collectors, that means prioritizing assets with tangible use cases: virtual land deeds, in-game items, or fractionalized RWAs. The quantity of trades might dip, but the quality of demand is rewriting the rules. The 2025 NFT sales volume story isn’t about decline. It’s about strategic capital allocation in a market valuing durability over hype. Let’s dissect why.
H1 2025 Market Performance: Beyond the Headline Figures
The numbers tell a layered story. While NFT sales volume dipped 4.6% in H1 2025, revenue surged to $2.83 billion. This divergence reveals a market prioritizing value density over transaction count. Consider July’s spike: $574 million in sales (47.6% monthly surge), average sale price hit $113.08, a six-month high, and unique buyers fell 17% month-over-month to 713,085.
Minting vs. Buying: The Great Divide
Creators flooded chains with 85M+ new NFTs. Yet collectors grew selective. High-value assets absorbed capital while low-utility projects languished. The result? Fewer transactions, higher spend per deal.
Institutional Catalysts
Traditional finance is reshaping demand: 15% of NFT revenue now comes from institutions, fractionalized blue-chips dominated Q2, and SEC-approved NFT index funds attracted $290M in Q1.
Why Volume ≠ Value Anymore
Three dynamics explain the paradox: Blue-Chip Flight – Collectors shifted to “safe” assets. CryptoPunks did $69.2M in July trades alone. Institutional-Grade Trading – Platforms like OpenSea saw 30% of deals involve fractional ownership. Minimum bids rose 22%. Speculative Purge – Meme NFTs volume crashed 63%. Capital recycled into utility projects.
Gaming NFTs illustrate this best: Generated $12.9B revenue in H1 (38% of total volume), Mad Lads on Solana saw 200% holder growth, and play-to-own models boosted retention by 58%.
Value Concentration: Why Fewer Transactions Yielded Higher Revenue
The 2025 paradox boils down to capital consolidation. Collectors aren’t spreading bets—they’re doubling down on proven value.
Blue-Chip Renaissance
CryptoPunks dominated July with $69.2M sales (12% of Ethereum’s total volume). Pudgy Penguins floor prices surged 65.44% in Q2. Investors treat top-tier NFTs like digital real estate.
The Premiumization Shift
The $113.08 average sale price (July 2025) isn’t accidental. Compare: 2023 Avg. Price: $78.21, 2024 Avg. Price: $89.50, 2025 Avg. Price: $103.40 (H1). Buyers now pay premiums for: Scarcity (sub-10K collections), utility (gaming/licenses), and royalty streams.
Institutional Mechanics
High-value trading exploded via: Fractional Ownership – 30% of OpenSea’s $14.68B volume involved split assets. Index Funds – SEC-approved NFTX funds hold baskets like PUNKS-HODL (up 31% YTD). Whale Accumulation – 9% of wallets hold 46% of NFT value.
The Speculative Purge
While blue-chips rose, low-utility projects collapsed: Meme coin-linked NFTs volume: ▼63% YoY, “Rug pull” incidents: ▼81% since 2023, and average hold time for sold NFTs: ▲122 days (vs. 2024). The message is clear: NFT sales volume 2025 reflects capital migrating away from noise and toward durable value.
Blockchain Wars: Ethereum’s Dominance & Emerging Challengers
The NFT landscape is no longer a one-chain ecosystem. While Ethereum remains the backbone, rivals are carving significant niches.
Ethereum: The Institutional Anchor
62% market share in H1 2025 NFT transactions, $275.6M July sales (+56% MoM growth), and leads due to liquidity depth, institutional custody solutions, and established security.
Bitcoin’s Ordinals Revolution
Bitcoin NFTs defied expectations: $74.3M July sales (+22% MoM), Ordinals inscriptions: 18.4M created by August 2025, and appeal lies in immutable on-chain storage. Collectors pay premiums for “digital artifacts.”
The Altchain Shakeout
Smaller chains face volatility: Cardano showed the most significant percentage growth at 102%, Solana saw modest gains of 8%, and Polygon’s sales volume fell by 51.1% from the previous month.
Tezos’ Eco-Edge
Carbon-neutral chain attracted 41K+ eco-conscious artists, 1.2M NFTs minted in H1, and average mint fee: $0.03 (vs. Ethereum’s $4.20).
Why Collectors Diversify Chains
Cost Control: Tezos for affordable art minting. Niche Utility: Bitcoin for rare digital artifacts. Speed/Gaming: Solana for instant in-game NFT trades. RWA Focus: Polygon for tokenized real-world assets. The NFT sales volume 2025 redistribution proves chains now compete on utility specialization, not just scalability.
Sector Deep Dive: Gaming, RWAs, and Music Drive Growth
Utility is the new alpha. While speculative assets flounder, three sectors fueled 70% of 2025’s NFT sales volume growth.
Gaming NFTs: The $12.9B Engine
38% of total NFT volume in H1 2025, Mad Lads on Solana: 200% holder growth, $46M secondary sales, Axie Infinity: Daily active users ▲ 58% with play-to-own land deeds, and Parallel TCG: $19M April sale of AI-themed card packs.
Why collectors win: Gamified assets generate yield through item rentals, crafting material sales, and land monetization.
Real-World Assets (RWA): Tokenization Breakthrough
$1.4B market (+32% YoY), Courtyard’s Pokémon cards: $23.8M in secondary sales, real estate deeds: Miami penthouse fractionalized into 10,000 NFTs ($2M raised in 72h), and supply chain NFTs: DHL’s shipment authenticity tokens cut fraud by 34%.
Music & Sports: Fan Engagement Reloaded
1.8M NFT tickets issued in 2025 (Teams save 30% on scalping), royalty NFTs: Kings of Leon album tokens pay 18% APY on streams, and NBA Top Shot 2.0: Added playoff moment stakes (Holders get playoff ticket access).
Brand case study: TIME Magazine dropped 12,000 “TIMEPieces” NFTs with IRL perks, holder engagement ▲ 30% vs. email subscribers, and generated $10.6M in direct revenue.
The takeaway: 2025’s NFT sales volume consolidation isn’t about decline—it’s capital migrating to assets with provable utility. Memes need not apply.
Collector Strategies: Navigating the New Value Paradigm
Savvy NFT collectors aren’t chasing volume—they’re engineering value. Here’s how top portfolios are adapting.
The 40-60-30 Allocation Framework
40-60% Blue-Chip Anchors: CryptoPunks, BAYC, and Art Blocks dominate core holdings. Why: 92% maintained or gained floor price during May’s 34% market dip. 30% Utility Players: Gaming (Axie land), hybrid NFTs (Nike Cryptokicks), music royalties. Target assets with revenue share or IRL benefits. 30% RWA & Emerging Sectors: Tokenized collectibles (Courtyard), carbon credits, luxury goods.
Tactical Rotation: Capitalizing on Volatility
Post-Dip Opportunities: When blue-chips dip 15%+, institutions buy (see July’s $290M NFT fund inflows). Sector Rotation: Shift from gaming → RWAs during Bitcoin volatility (RWAs showed 22% lower correlation). Liquidity Signals: Monitor OpenSea’s “Bid/Ask Spread” dashboard for exit timing.
Hybrid Utility: The Physical-Digital Edge
Assets bridging both worlds outperformed: Nike Cryptokicks – NFT unlocks custom sneakers (60% volume ▲), TIME Magazine – NFT → print subscription (30% engagement ▲), and VeeFriends NYC – NFT = conference access (Sold out in 8 min).
Pro Tip: Use platforms specializing in your niche: Gaming: Immutable X (zero gas fees), Art: SuperRare (curated drops), RWAs: Courtyard (physical-backed assets).
Avoid These 2025 Traps
Meme NFT FOMO: Azuki spin-offs crashed 74% post-mint. Low-Royalty Projects: Sub-5% royalties lack creator incentives. Single-Chain Exposure: Diversify across 3+ blockchains.
H2 2025 Outlook: Rebound Signals & Regulatory Frontiers
The market is pivoting from consolidation to controlled growth. Here’s what collectors must watch.
Accelerating Recovery Metrics
NFT Market Cap: Surged 94% to $7B in July. Weekly Trading Volume: Up 51% in early August. Catalyst: Bitcoin’s post-halving stability (+40% YTD) boosted investor risk appetite. Caution: Analysts project a “tempered rebound” – expect 15-20% H2 growth, not 2021-style mania.
Institutional Catalysts Going Mainstream
Three game-changers for Q3-Q4: Corporate Treasuries: Nike allocated 2% of cash reserves to Cryptokicks IP NFTs. Gucci’s Vault Art collection generated $7.3M in secondary royalties. Tokenized RWAs: Carbon credit NFTs hit $300M market. Real estate deed fractionalization grew 120% YoY. Index Products: SEC-approved PUNKS-HODL ETF crossed $290M AUM. BlackRock’s NFT fund prospectus filed August 2025.
Regulatory Make-or-Break Zones
Jurisdictions are diverging: United States (41% of global buys) – Positive impact; SEC’s “utility asset” clarification (Q4 2025). EU – Neutral impact; MiCA compliance deadline (Dec 2025). Asia-Pacific (33.7% CAGR) – High Growth ▲; Hong Kong’s RWA licensing (Oct 2025).
Red Flag: The IRS’s proposed 28% NFT capital gains tax could dent U.S. retail participation if passed.
Chain-Specific Opportunities
Ethereum: Layer-2s (Arbitrum, Base) will slash gaming NFT gas fees by 75%. Bitcoin: Ordinals “rare sat” NFTs gain traction as digital gold 2.0. Solana: Firedancer upgrade aims to prevent 2024-style outages, boosting gaming reliability.
Mastering the Mature NFT Market
The $2.83 billion H1 2025 NFT sales milestone—achieved amid falling volume—confirms a fundamental shift: quality now dominates quantity. This isn’t a downturn; it’s an upgrade.
The NFT 2.0 Imperative
To thrive, collectors must embrace three pillars: Quality Over Quantity – Rising average prices ($113.08 in July) prove capital flows to utility and scarcity. Blue-chip NFTs act as volatility hedges, with 92% floor price resilience. Chain-Agnostic Strategy – Ethereum for liquidity, Bitcoin for permanence, Solana for gaming speed. Diversify across 3+ chains to capture sector-specific growth. Hybrid Utility Mandate – Target assets bridging physical/digital value: Nike’s Cryptokicks (60% volume growth), TIME’s holder perks (30% engagement lift), and RWA tokenization (32% YoY expansion).
Institutionalization = Validation
Traditional finance isn’t disrupting—it’s validating: BlackRock’s NFT fund filing, $290M in SEC-approved index products, and corporate treasuries (Nike, Gucci) entering.
Your H2 2025 Action Plan
Monitor: Ethereum-based RWA projects (Courtyard) and gaming NFTs (Immutable X). Avoid: Meme NFTs, single-chain exposure, sub-5% royalty projects. Act: Use institutional dashboards for real-time liquidity signals.
The NFT sales volume 2025 reset isn’t an anomaly—it’s the new blueprint. Adapt or fade.


