
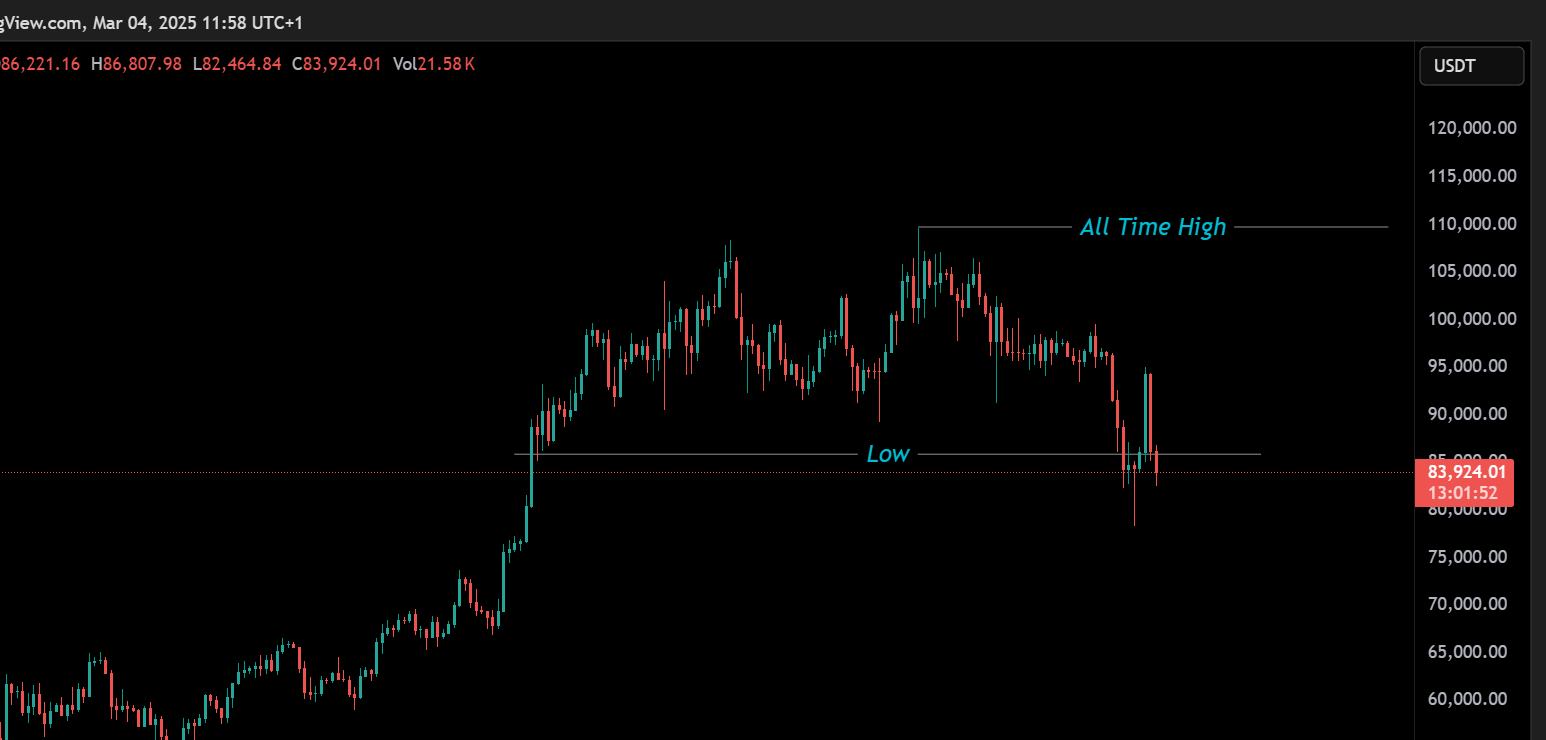
The cryptocurrency market remains a thrilling roller coaster, with Bitcoin and the broader crypto space experiencing dramatic shifts recently. After Bitcoin Reached an all-time high (ATH) of $109,000 closing daily at $106,000 the market entered a consolidation phase, only to face a steep drop in February. This plunge swept past the November low of $87,400, bottoming out at $79,000, rattling traders and sparking debate: Is this a mere correction, a liquidity sweep, or the onset of a bear market? Let’s unpack the current landscape through technical analysis, market sentiment, and fundamentals to provide clarity for traders and enthusiasts alike.
The Big Picture: Bull Run or Bear Market?
Bitcoin’s climb to $109,000 marked a euphoric milestone, but the subsequent consolidation and February’s sharp decline—wiping out gains and hitting $79,000—shifted the narrative. This kind of volatility is crypto’s signature: sudden, gut-wrenching drops that liquidate over-leveraged positions and test investor resolve. The pressing question is whether this signals the bull run’s end or just a pause before the next surge. To answer, we’ll explore the charts, sentiment, and underlying drivers.
Technical Analysis
Liquidity Sweep and Hammer Candle
The drop to $79,000 appears as a textbook liquidity sweep—a rapid price plunge designed to trigger stop losses and clear out leveraged traders before rebounding. Following this, a hammer candle emerged, a bullish reversal pattern where buyers forcefully stepped in, rejecting lower prices. While promising, it’s not a definitive bottom confirmation requires sustained upward momentum.
Key Levels to Watch
- Support: $79,000 is now the line in the sand. Holding above it keeps the bull market alive; a break below could spell deeper trouble, potentially ushering in a bearish phase.
- Resistance: $87,400 (November low) and $106,000 (recent ATH close) are critical hurdles. Clearing $87,400 could reignite optimism, while surpassing $106,000 would signal the bull run’s revival.
Bitcoin Market Structure
Bitcoin’s trapped in a broad range between $79,000 and $109,000. This consolidation after a rally is typical, and history suggests the longer it persists, the more explosive the eventual breakout to the up or down side. Traders should monitor these boundaries closely for directional cues.
Market Sentiment: Fear vs. Greed
Crypto thrives on emotion, and the recent dump flipped sentiment from exuberant greed to palpable fear. Tools like the Crypto Fear & Greed Index reflect this shift, but fear isn’t always a bad sign—it often marks local bottoms, offering contrarian buy signals. Still, the community’s split: bears argue the bull run’s exhausted, pointing to the failure to hold new highs, while bulls see this as a cleansing shakeout of weak hands. Sentiment’s duality suggests caution—fear can be a buying opportunity, but unchecked, it can snowball.
Bitcoin Fundamentals: The Market’s Backbone
Institutional Adoption
Big players continue to embrace Bitcoin, with corporations and funds stacking it on their balance sheets. This steady inflow of institutional capital bolsters the long-term bullish case, signaling crypto’s maturation as an asset class.
Regulatory Landscape
Regulation remains a wild card. Positive moves—like Bitcoin ETF approvals or supportive laws—could turbocharge prices. Conversely, restrictive policies or crackdowns might amplify downside pressure. Clarity here is pivotal.
Macroeconomic Influences
Bitcoin’s “digital gold” allure persists amid inflation and geopolitical unrest, yet its growing correlation with risk assets (e.g., stocks) ties it to broader economic trends. Rising interest rates or global uncertainty could sway its trajectory.
What’s Next? Three Scenarios
Bullish Path
- Bitcoin defends $79,000 and breaches $87,400.
- A push past $106,000 reignites the bull run, eyeing new ATHs.
- Catalyst: Positive fundamentals or technical breakout.
Bearish Turn
- A drop below $79,000 with no quick recovery signals trouble.
- Next stop: $60,000 (hypothetical support).
- Trigger: Worsening sentiment or macro headwinds.
Sideways Stalemate
- Bitcoin oscillates between $79,000 and $109,000 for weeks or months.
- Ideal for range traders, tedious for trend seekers.
- Outcome: A breakout looms, direction TBD.
Tips for Traders and Investors
- Risk Management
Crypto’s volatility demands discipline. Set stop losses, size positions conservatively, and never risk more than you can lose.
- Dollar-Cost Averaging (DCA)
Long-term believers can use DCA to buy steadily, mitigating the impact of swings and building positions over time
- Stay Ahead
This market moves at warp speed. Track reliable news, monitor technical and fundamentals, and adapt as conditions shift.
Volatility Is the Game
The crypto market’s latest twist—February’s brutal dump—has sparked uncertainty, but it’s not game over. The liquidity sweep, hammer candle, and $79,000 support hint at resilience, yet a break below could flip the script. Zooming out, institutional inflows, regulatory developments, and macro trends keep the long-term story compelling.
For now, vigilance is key. Watch the charts, gauge the crowd, and anchor your moves in fundamentals. Whether we’re teetering on a bull revival or a bearish slide, crypto’s journey is far from done. Embrace the chaos, manage your risk, and stay tuned—the next chapter’s already unfolding. Happy trading!


